Low feature adoption is a common challenge for SaaS products, with a direct impact on retention, satisfaction, and revenue. Here's how to solve it with a data-driven approach.
Key takeaways
- Identify the barriers: the most common problems are poor onboarding, low visibility, and usability issues.
- Analyze user behavior: tools like Screeb (session replays) and Amplitude (analytics) help spot friction points and adoption trends.
- Combine data and feedback: behavioral data shows what users do; feedback explains why.
- Test and optimize: use A/B testing to refine onboarding, feature placement, and communication.
Quick steps to improve adoption
- Track metrics: measure feature awareness, activation, and frequency of use.
- Refine onboarding: personalize experiences by user segment.
- Encourage engagement: use targeted, well-timed in-app messages.
- Iterate continuously: review the data regularly and adjust features based on users' needs.
By focusing on user behavior and feedback, you can methodically reduce friction, optimize your features, and increase adoption rates.
Identifying the reasons for low adoption
Common barriers: onboarding, visibility, and usability
Low adoption of a feature often comes from weak onboarding, lack of visibility, or usability issues. Users may not understand the feature's value, struggle to find it, or stop using it because of frustrating experiences. Tools like Screeb's session replays can show where users run into these problems, for example the steps with a high drop-off rate.
| Type of barrier | Impact | How to detect it |
|---|---|---|
| Poor onboarding | Users miss the feature's value | Analytics, drop-off rate |
| Low visibility | Users don't notice the feature | Heatmaps, discovery metrics |
| Usability issues | Users give up on the feature | Session replays, drop-off rate |
Fixing these barriers matters, but it's just as important to make sure the feature solves real problems for users.
When features don't match user needs
Even well-designed features can struggle if they don't solve the right problems. This mismatch appears when features don't address users' friction points or expectations, and users lose interest. By combining behavioral data with direct user feedback, teams understand why a feature isn't finding its audience.
Signs of a mismatch between features and user needs:
- low engagement across different user groups;
- negative feedback in surveys or support tickets;
- a high drop-off rate after first use.
Using data to understand feature engagement
Behavioral analytics tools: Screeb, Amplitude, and others
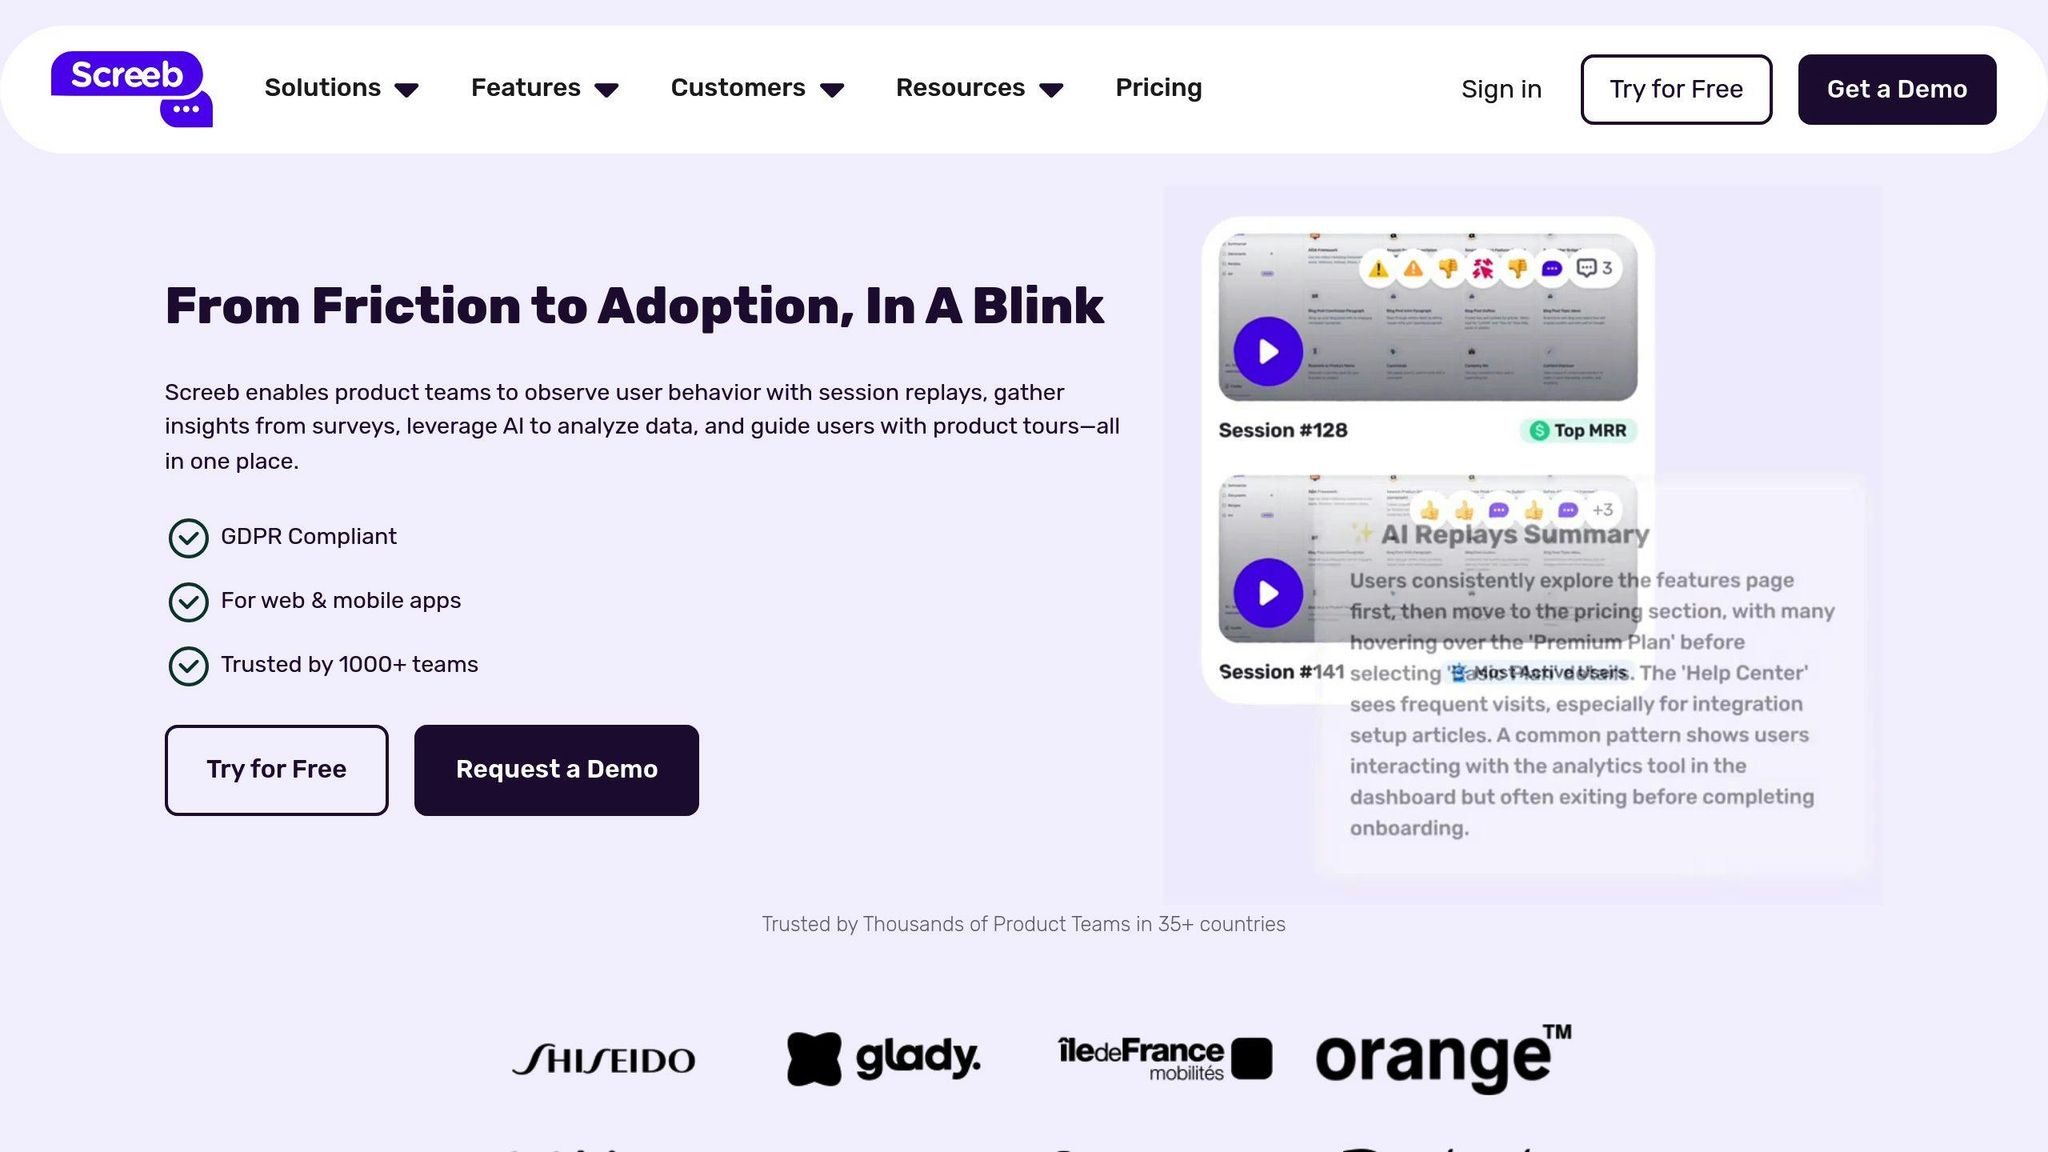
Platforms like Screeb and Amplitude help teams understand how users interact with features. Screeb uses AI to surface patterns in how users discover features, while Amplitude focuses on tracking adoption trends across different user groups. Combined with visualization tools like heatmaps, they offer a detailed view of user behavior.
| Analytics tool | Key capabilities | Main use |
|---|---|---|
| Screeb | Session replays, user journey analysis | Spot friction points |
| Amplitude | Feature usage tracking, engagement metrics | Measure adoption trends |
| Heatmaps | Click patterns, scroll depth | Visualize feature discovery |
These tools excel at providing numbers and patterns, but combining them with user feedback gives a clearer picture of the difficulties users face.
Combining user feedback and behavioral data
Behavioral data tells you what users do; feedback explains why they do it. By merging these two perspectives, teams better understand the obstacles that keep users from fully adopting features.
To address these obstacles methodically, the ARIA framework serves as a guide, alongside tools like Screeb and Amplitude:
- Analyze: study both behavioral data and feedback.
- Reduce: eliminate friction points in the user journey.
- Introduce: present features in a way that makes sense to users.
- Assist: offer help so users succeed.
Testing features with A/B experiments
A/B testing lets teams test their hypotheses and refine their features through controlled trials. For example, Wudpecker.io increased its feature adoption by 20% in just three months by experimenting with its onboarding journeys and personalizing its in-app messages. Its tests focused on key elements: when to introduce features, where to place them in the interface, the onboarding process, and how easy it is to access help documentation.
“Feature adoption makes the product successful. Analyze, reduce friction, and optimize engagement.” (Statsig, 2024)
Concrete steps to improve feature adoption
Personalizing onboarding and in-app help
Design onboarding journeys tailored to different user segments, introducing features gradually based on their level of engagement and readiness. Introduce features at the moments when users are most likely to find them useful and relevant. This approach avoids overwhelming users and increases the chances they'll adopt the features.
Once onboarding is tailored to users' needs, reinforce adoption with timely, relevant communication.
Encouraging usage with targeted messages
Drive adoption by sending well-timed messages at key moments: feature discovery, activation, and reinforcement after use. The timing and context of these prompts play a crucial role in encouraging users to explore features and keep using them. For example, when a user completes a specific workflow, suggest related features that naturally extend their experience in the product.
These targeted messages help spark initial interest, but ongoing adjustments based on user data are essential to sustain engagement.
Refining features based on data
To keep features useful and engaging over time, rely on data to guide your improvements. Track the key metrics that show how features are performing:
| Metric | Actionable takeaway |
|---|---|
| Feature awareness | Make features easier to find |
| Activation rate | Simplify first use |
| Frequency of use | Focus on delivering value consistently |
Prioritize your changes using quantitative data, while taking user feedback into account. This combination helps teams identify and address users' real problems, rather than relying on assumptions.
Boosting product adoption with behavioral analysis
Case study: improving feature adoption with data
Here's a concrete example of how a SaaS company tackled low feature adoption with data-driven strategies.
Understanding the problem and initial findings
A mid-sized SaaS company noticed that only 12% of users adopted its new collaboration features after launch. By analyzing session replays and behavioral data, it identified the main problems:
| Issue | Data source | Key finding |
|---|---|---|
| Discovery | Session replays | 67% of users never clicked the feature's menu |
| Onboarding | User journey analysis | Most users abandoned the setup process |
| Interface | Behavioral data | Tasks took three times longer than expected |
These findings highlighted problems in how users discovered and interacted with the feature, as well as in the setup process itself.
The solutions implemented and the results achieved
The product team took a targeted approach to these challenges:
- Better feature discovery: based on heatmap data, it redesigned the interface to make the collaboration features more visible. Feature discovery rose by 45% within the first month.
- Simplified onboarding: A/B testing showed that adding tooltips and contextual guides significantly reduced drop-off during setup, by 51%.
- Optimized interface: by analyzing user behavior, the team simplified workflows and cut the time needed to complete tasks by 65%. Automated in-app prompts were added to help users at critical steps.
Lessons learned and tips for success
These changes led to a sharp rise in feature adoption and provided valuable lessons for tackling similar challenges. The team's focus on integrating user feedback and data analysis proved decisive. Iterative testing ensured that each solution had a measurable impact.
Here's how the key metrics progressed over three months:
| Metric | Baseline | After 3 months |
|---|---|---|
| Feature discovery | 33% | 78% |
| Setup completed | 18% | 69% |
This case clearly shows that a structured, data-driven approach can produce significant improvements in feature adoption, as long as you track and refine features over time.
Conclusion and next steps
Recap of key strategies
Increasing feature adoption starts with understanding user behavior. The ARIA framework offers a clear method for identifying and improving feature usage. Companies that excel at this rely on three main strategies:
| Strategy component | Key activities | Impact metrics |
|---|---|---|
| Behavioral analysis | Session recordings, heatmaps, click analysis | Understanding how users interact with features |
| User segmentation | Personalized experiences, targeted messages | Higher feature discovery rates |
| Iterative testing | A/B testing, feature improvements | Notable progress in adoption metrics |
The case study shows how applying these strategies over time can improve adoption rates.
Where to start
Improving feature adoption starts with measuring your baseline across four critical stages: exposed, activated, used, and reused. From there, follow these steps:
- Set up analytics tools. Use platforms like Screeb or Amplitude to track user behavior and collect their feedback.
- Define your metrics. Focus on the ones that provide useful insights, such as:
- feature adoption rate;
- adoption by user segment;
- time to first use;
- long-term engagement.
- Commit to continuous improvement. Review your metrics regularly, adjust features every month, and evaluate your strategies every quarter.
By following these steps, you build these strategies into your product development process. Start from clear goals, rely on data to guide your decisions, and keep refining based on how users interact with your product.
FAQ
What is feature usage in analytics?
Feature usage measures how many users interact with specific features of your product. It's calculated with the following formula:
(feature users / total product users) × 100.
For example, if 2,500 out of 10,000 users use a feature, its usage rate is 25%.
| Metric | Description | Why it matters |
|---|---|---|
| Time to first use | Time between sign-up and first use of the feature | Helps assess onboarding success |
| Frequency of use | How often users interact with the feature | Shows how engaging the feature is |
| Feature abandonment | Percentage of users who stop using it | Flags possible usability issues |
Breaking down feature usage by user segment often reveals key insights. For example, enterprise users may adopt advanced features at a 45% rate, versus only 15% for small businesses. These gaps help identify where to focus improvement efforts.